

Using the data provided by the City of Evanston regarding property violations between 2013 and 2022, I am most interested in looking for trends and patterns that help to show if specific property standards and municipal policies are operating as intended. At the very core, that means properties which are:
- Safe and healthy/sanitary and in compliance with the zoning/codes of the area where the property is located
For commercial property, there will be an owner of the property, as well as commercial tenants who may or may not be the owners of the property.
In the case of residential housing, residents can be the homeowners or renters of a property. And this is where the data available to the public via the City of Evanston can get confusing.
Why do we care?
Violations such as those related to building codes/permits are to ensure that work is done safely so that occupants and neighbors aren’t injured or made unsafe (e.g. poorly installed electrical work causing fires, accumulation of trash attracting rodents, etc.)
There are also specific violations related to landlords who are responsible for the well-being of their renters in regards to basic health and safety standards (e.g. safe water access, indoor heating with is safe, air quality within the building, etc.)
All of these issues are related to liveability, safety, property values, and so on.
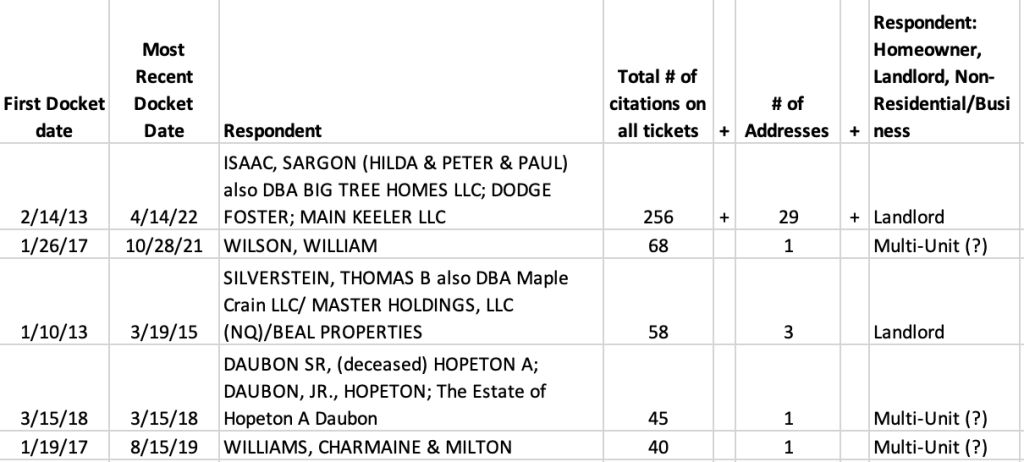
As for who had the most violations in this period, known landlords and multi-unit owners (who might be landlords) were best represented in the Top 5 property owners with violations:
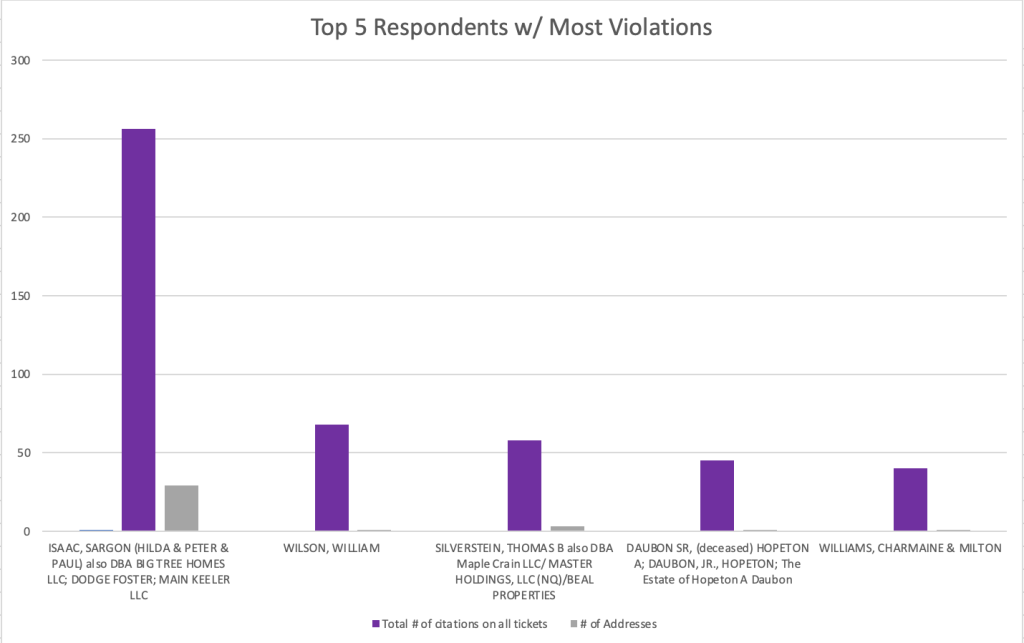
Source Data: Violations per Respondent via COE Property Dockets
The amount of violations accrued by the property owner in the top spot is a 276%+ increase over the property owner in the #2 spot.
What other trends can we see in this data? And what are the implications?
For a summary of all blog posts about Property Violations, click here.
